View Journal Details
You can view the Alarm info and Entity info fields for each alarm when selecting the relevant alarm in the table.
| ➢ | Do the following: |
| 1. | Select the journal entry whose details you wish to view. |
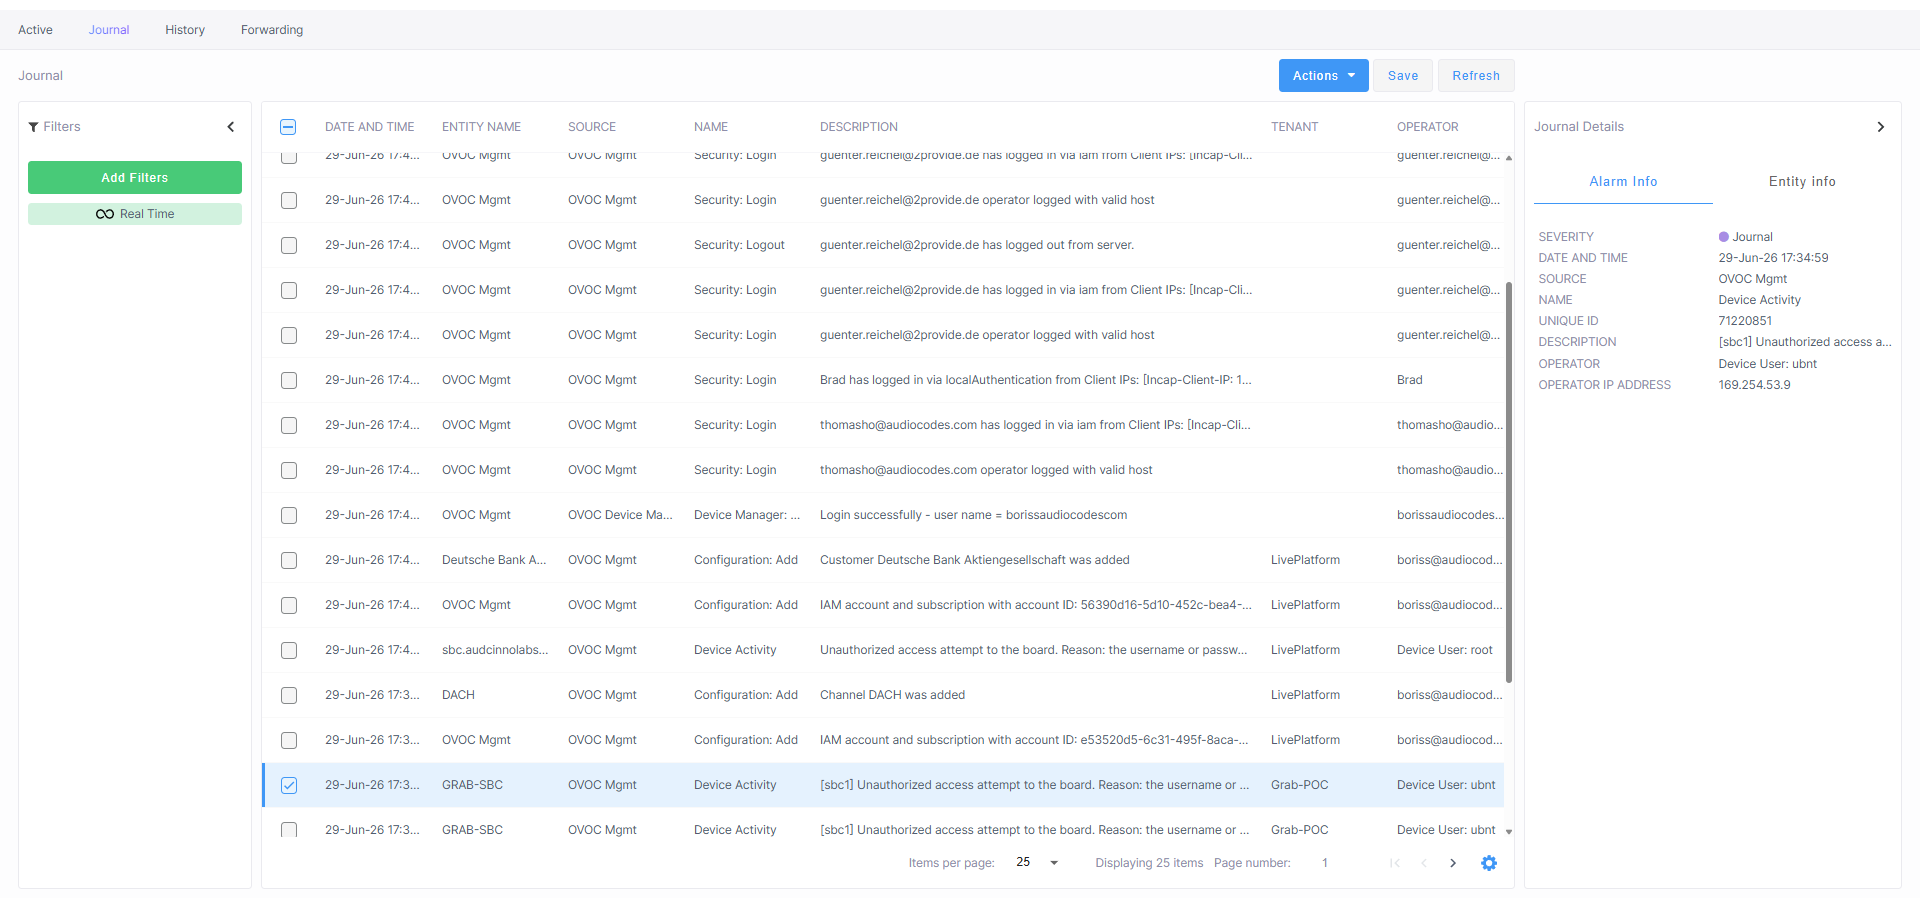
The table below describes the Journal fields.
|
Parameter |
Description |
|||||||||
|---|---|---|---|---|---|---|---|---|---|---|
|
Alarm Info |
||||||||||
|
Severity |
The unique indicator (colored purple) representing all journal entries. |
|||||||||
|
Date and Time |
The timestamp indicating when the journal entry was generated. |
|||||||||
|
Source |
The source entity where the alarm is raised:
|
|||||||||
|
Name |
The name of the journal action:
|
|||||||||
|
Unique ID |
The unique index for the alarm on the source device:
|
|||||||||
|
Alarm ID |
The unique database ID index for the alarm in the Live Platform portal database. |
|||||||||
|
Description |
Description of the journal action that is displayed in the Live Platform portal. |
|||||||||
|
Operator |
The name of the admin user who performed the action. |
|||||||||
|
Operator IP Address |
The IP address of the device from which the operator accessed Live Platform portal. |
|||||||||
|
Entity Info |
||||||||||
|
Entity Name |
The name of the entity upon which the action was performed. |
|||||||||
|
Tenant |
The name of the Service Provider tenant to which the entity is attached. |
|||||||||
|
Entity IP Address |
The IP address of the managed entity. |
|||||||||
|
Region |
The name of the region to which the entity is attached. |
|||||||||
|
Site |
The name of the site to which the entity is attached. |
|||||||||